Who Counts?

Listen to the audio version by clicking the play button above.
An architect once told me that they didn’t realise the importance of accessibility in their designs until they learned how many people have a disability.
Most of us don’t realise how many people live with an impairment because we don’t see them in proportional numbers in our daily lives. One of the many reasons for this is that the environments we have created make it too hard for some people to participate. Therefore, we never encounter them.
The social model of disability demonstrates that it is not someone’s condition that makes them disabled, but rather the structures and attitudes of society.
Let’s take a look at a few of the basic figures. If, like me, you appreciate numbers, you will enjoy this. And if not, don’t worry, the colourful illustrations tell the story.
The latest available data is from Statistics New Zealand’s 2013 Disability Survey, so these are the numbers I’ve used.
A significant proportion of our population – 24 per cent – is disabled, meaning optimal accessibility to and within our built environments is important to many people. This figure only accounts for those who openly identified themselves as having a disability. It does not include people who chose not to disclose this information, such as those with a hidden disability like dyslexia or chronic pain.

Of the people who are disabled, 53% have more than one type of impairment. Our built environment needs to consider the diversity of human ability in the spaces provided for everyone to use easily and safely.

Disability is not evenly represented across the population.
Māori are slightly more likely to be disabled than non-Māori, at 26 per cent.

The disabled population is not distributed evenly across the country
In Auckland, 19 per cent of people are disabled, but in Taranaki, the figure rises to 30 per cent.

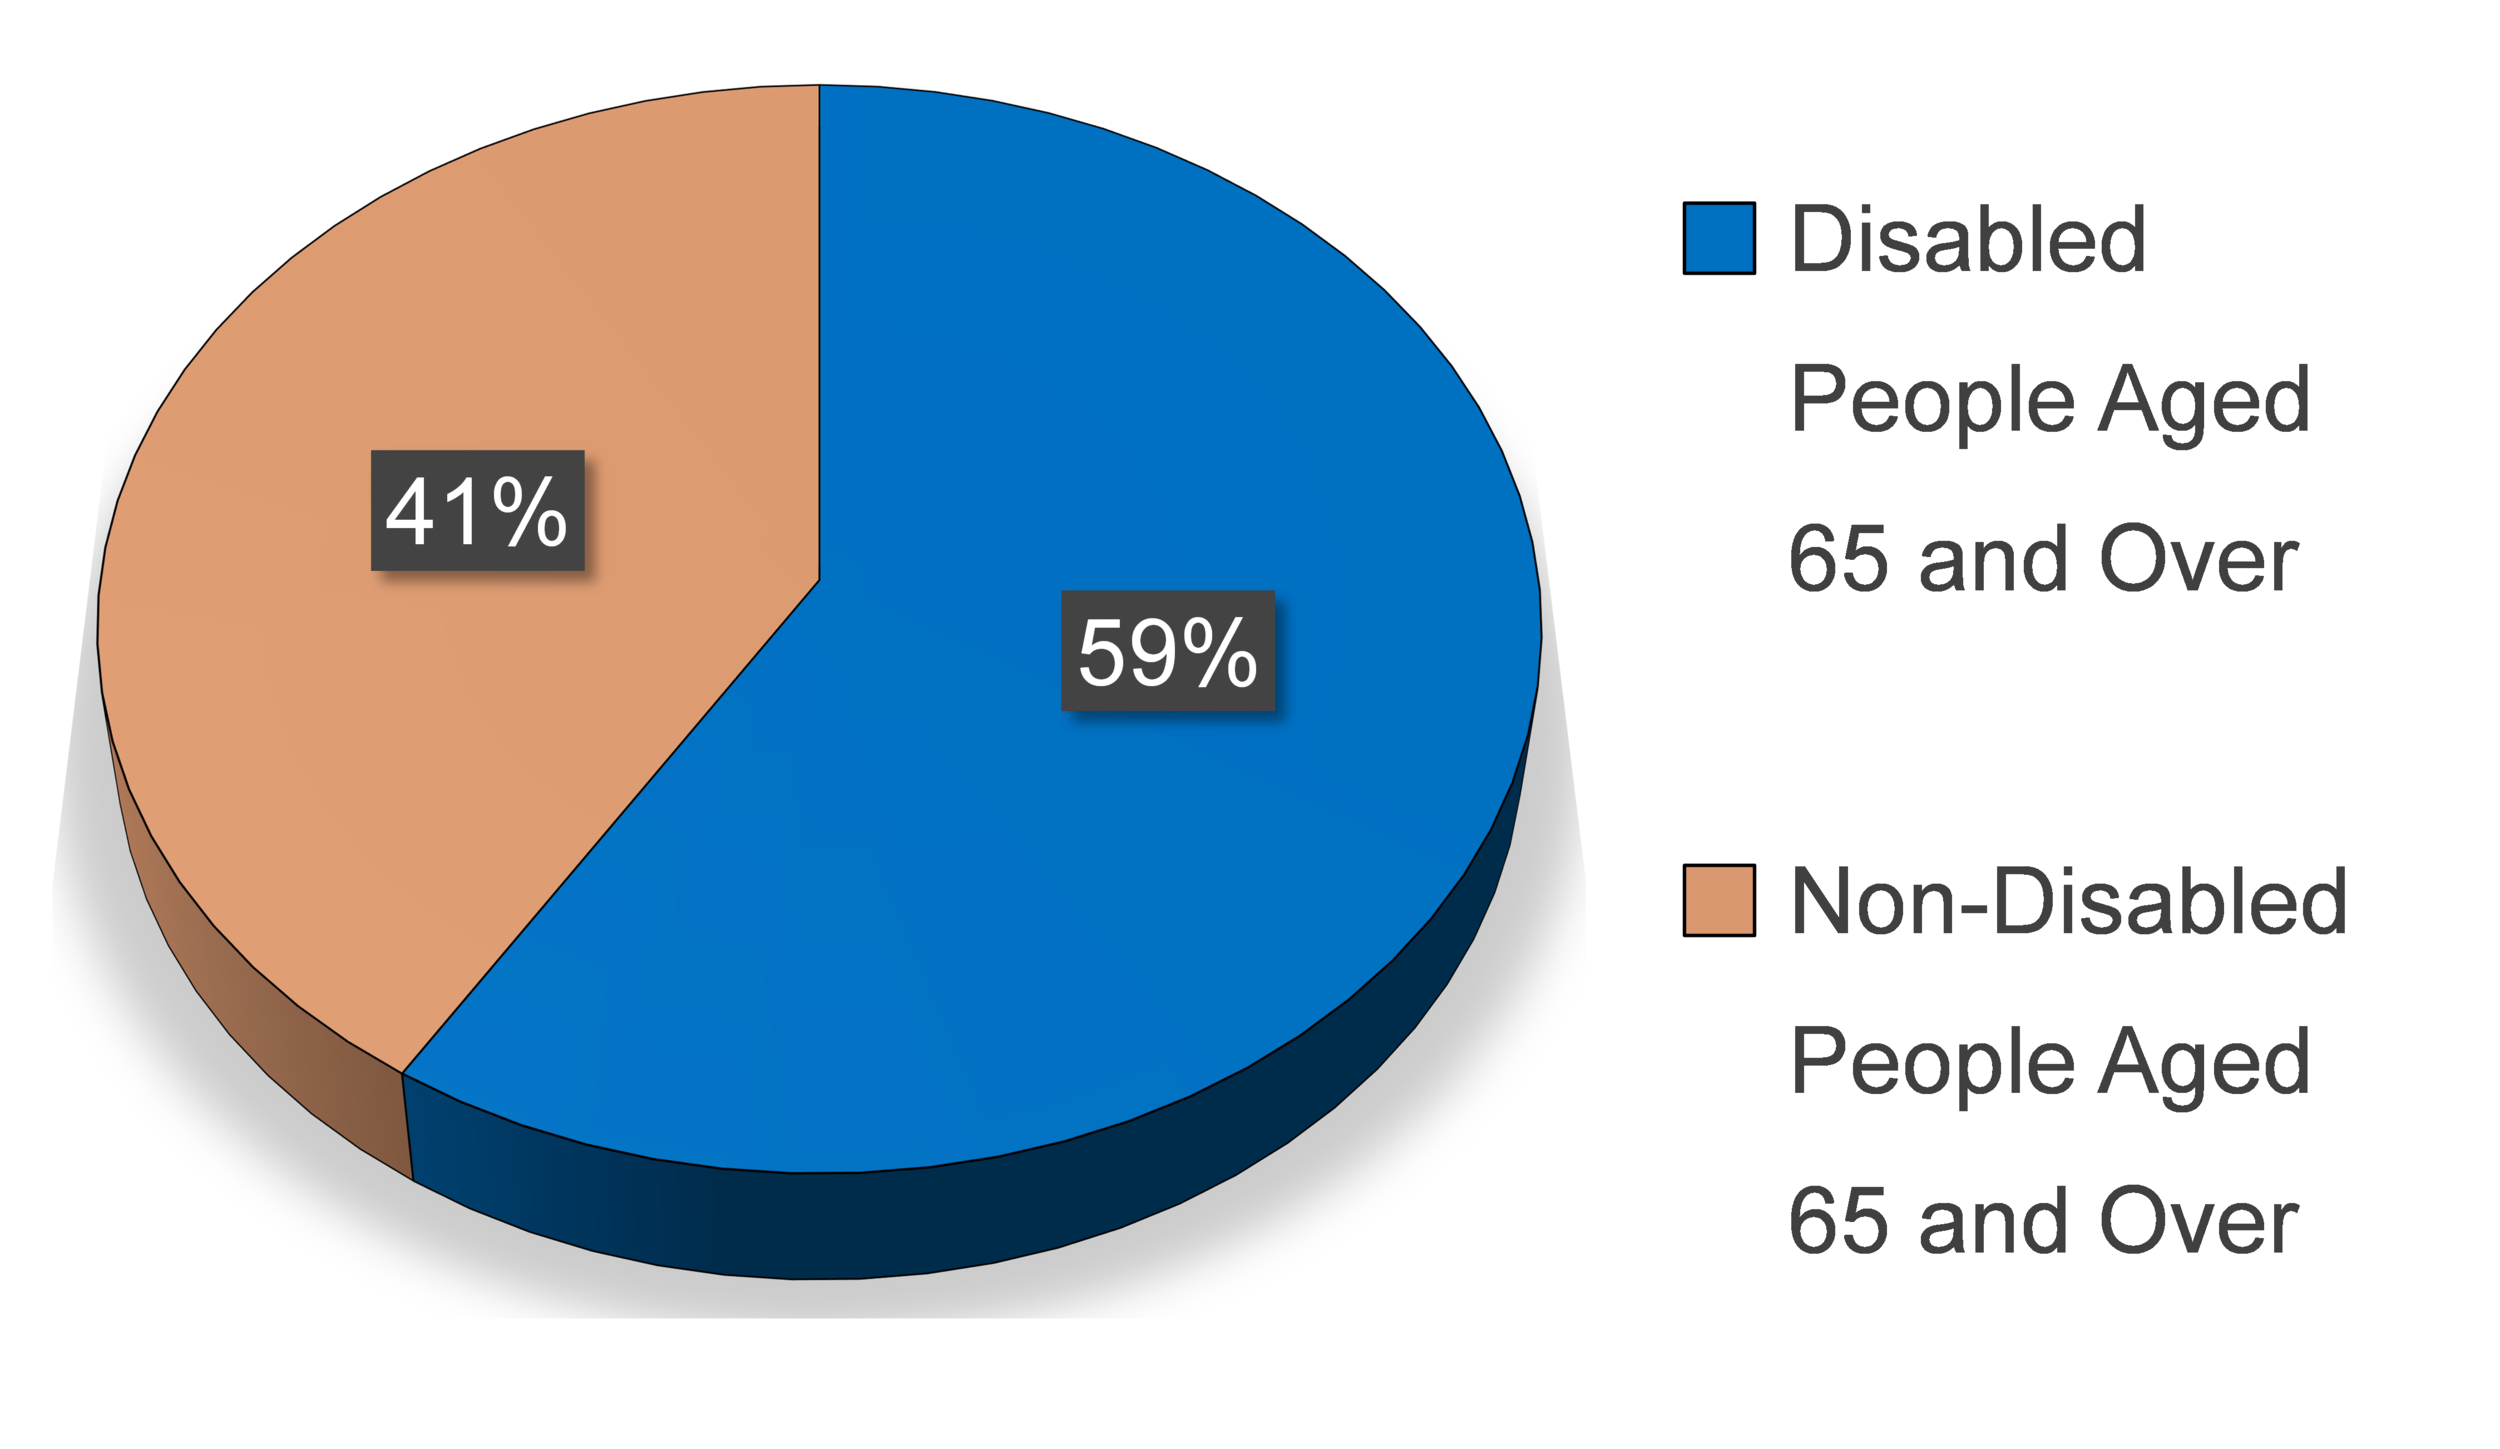
Disability disproportionally affects older people. In the 65-and-over demographic, 59 per cent of people are disabled. As New Zealand’s population ages, the percentage of people with disabilities will rise.
These are just a few of the interesting figures available from Statistics New Zealand about people with disabilities.
These are just a few of the interesting figures available from Statistics New Zealand about people with disabilities. I encourage you to have a closer look to better appreciate the diversity of the human experience. It may explain why the architect I spoke to now has a clearer perspective on why it is crucial to have a built environment that works equitably for everyone.
Who counts? We all do.